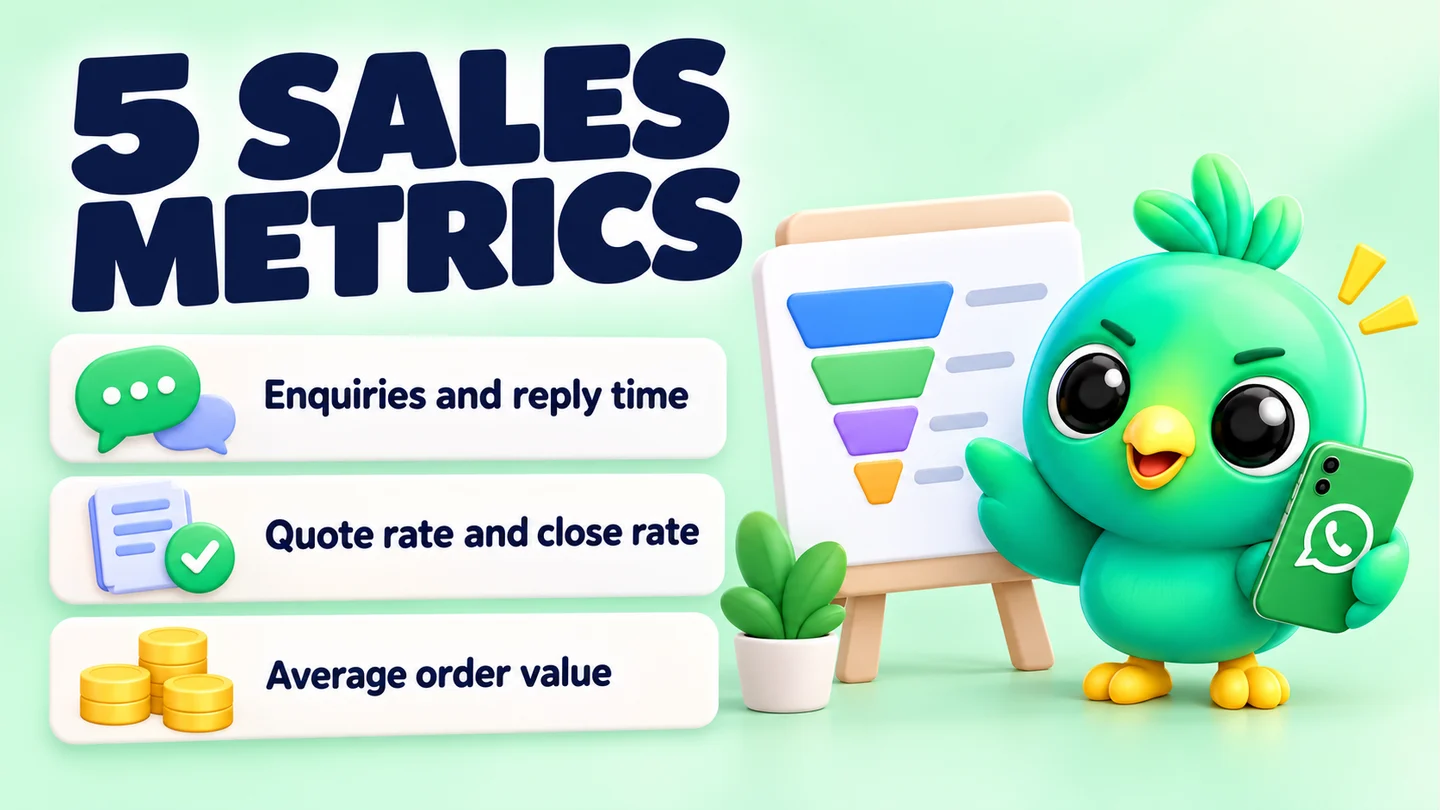
A WhatsApp sales funnel is the path from a first message to a paid order, and you can track it with five numbers: new enquiries, first-reply time, quote rate, close rate and average order value. Together they tell you whether you need more leads, faster replies, clearer prices or better follow-ups. You can work all five out from your own chats with a simple spreadsheet in about 20 minutes a week.
This post is part of our guide to WhatsApp CRM for small businesses. If you don't track leads yet, start with our free WhatsApp sales pipeline template and come back here once you have a week or two of data.
Why five numbers, and not fifty
Big sales teams track dozens of metrics. A 1–3 person business selling on WhatsApp needs a handful it will actually check. Each number below points to one specific action, so when it drops you know what to fix.
There is one rule for all of them: compare yourself with yourself. We don't give "good" conversion rates here, because a cake seller, a letting agent and a phone repair shop sell in completely different ways, and a borrowed benchmark can make a healthy business look broken. Your own last month is the benchmark that matters.
The five numbers at a glance
| # | Number | How to calculate it | If it drops, look at |
|---|---|---|---|
| 1 | New enquiries | Count of new sales chats this week, by source | Where you promote your number |
| 2 | First-reply time | How long new enquiries wait for your first reply | Quick replies and your daily routine |
| 3 | Quote rate | Quotes sent ÷ new enquiries | How you qualify and price |
| 4 | Close rate | Won ÷ (Won + Lost) | Follow-ups and objections |
| 5 | Average order value | Total value of won deals ÷ number of won deals | Bundles, add-ons and pricing |
Multiply enquiries by your overall conversion (Won ÷ enquiries) and by average order value, and you get revenue. That's the whole funnel in one line.
1. New enquiries
What it is: the number of new people who messaged you about buying something this week. Leave out existing customers asking where their parcel is. That's support, not sales.
How to count it: add a row to your tracker for every new sales chat, with the date of first contact and the source. In a spreadsheet, a weekly count looks like this:
- Weekly count: =COUNTIFS(H:H,">="&DATE(2026,9,14), H:H,"<"&DATE(2026,9,21))
Here column H is "First contact", as in our pipeline template. Change the dates each week.
Track the source too. Give each channel its own WhatsApp link with a different pre-filled message ("Hi, I found you on Instagram"), and the first message tells you where the lead came from. WhatsApp's click-to-chat links support pre-filled text, and our free WhatsApp link generator builds them.
If it drops: the problem is before WhatsApp. Check whether you posted less, whether a link broke, or whether a channel has gone quiet.
2. First-reply time
What it is: how long a new enquiry waits before you first reply. You can track it as an average, or more simply as "share of new enquiries answered within [your target]". Pick a target that fits your hours, such as within one hour during opening times.
How to count it: unless a tool measures it for you, the easy manual method is to add a "Replied within target?" column with Yes or No for each new enquiry, then:
- Share within target: =COUNTIF(Q:Q,"Yes") / [number of new enquiries]
(Column Q is just the next free column; use whichever one you add.)
If it drops: you are probably answering in bursts. Saved answers help most here. The WhatsApp Business app has quick replies, and our WhatsApp message templates tool gives you wording for prices, availability and opening hours. A fixed routine helps too: our daily WhatsApp Web sales workflow sets aside time for new enquiries first.
3. Quote rate
What it is: the share of new enquiries that reach the point where you send a price, quote or options.
How to calculate it: quotes sent this period ÷ new enquiries this period.
If it's low: lots of people are asking, but few get as far as a price. Common reasons include enquiries from outside your delivery area, people who only wanted a rough idea, and conversations that stall because you asked too many questions before giving any number. Look at ten recent chats that never got a quote and see which one it is. Sometimes the fix is a price range in your first reply. Sometimes it's being clearer on your profile about what you don't do.
If it's very high: that's usually fine, but check you are not spending hours quoting for people who were never going to buy.
4. Close rate
What it is: of the deals that reached a final answer, the share you won.
How to calculate it: Won ÷ (Won + Lost). In a spreadsheet:
- Close rate: =COUNTIF(E:E,"Won") / (COUNTIF(E:E,"Won") + COUNTIF(E:E,"Lost"))
Column E is "Stage" in our template.
Tip: Only count closed deals. If you divide by every lead, including ones still open, the rate falls every time you get busy, which tells you nothing.
If it drops: look at two things. First, your follow-ups: are quotes going quiet without a second message? Our WhatsApp follow-up message templates give you scripts and timing for that. Second, your Lost reasons. If you write down why each deal was lost, patterns appear quickly: too expensive, too slow, out of stock, bought elsewhere. Those are business decisions, not messaging ones.
5. Average order value
What it is: how much a typical won deal is worth.
How to calculate it: total value of won deals ÷ number of won deals. In a spreadsheet:
- Average order value: =SUMIF(E:E,"Won",F:F) / COUNTIF(E:E,"Won")
Column F is "Deal value". Type values as plain numbers (8500, not "Rs. 8,500") or the formula returns zero.
If it drops: you may be discounting more than you realise, or customers are choosing your cheapest option. Try offering a natural add-on at the quote stage, such as a gift box, a screen protector or a second viewing slot, rather than after they have paid.
A worked example (made-up numbers)
These numbers are invented to show the maths. They are not a benchmark.
Imagine a home baker in one month:
- 40 new enquiries
- 34 of them answered within the one-hour target
- 22 quotes sent
- 9 won, 8 lost, 5 still open
- Won deals worth 63,000 in total
| Number | Calculation | Result |
|---|---|---|
| New enquiries | Count | 40 |
| First-reply within target | 34 ÷ 40 | 85% |
| Quote rate | 22 ÷ 40 | 55% |
| Close rate | 9 ÷ (9 + 8) | 53% |
| Average order value | 63,000 ÷ 9 | 7,000 |
| Overall conversion | 9 ÷ 40 | 22.5% |
What would the baker look at first? The quote rate. Nearly half of the enquiries never got a price. Reading those chats might show that many were outside the delivery area, which is a profile fix, not a sales fix. Next month the baker compares these same six figures with this month's and changes one thing at a time.
Snapshot vs this week's cohort
There are two ways to count a funnel, and it helps to know which one you are looking at.
- A snapshot counts how many leads are in each stage right now. It's quick, and it shows where work is piling up today.
- A cohort follows the leads that arrived in one week or month and asks what happened to them. It's slower, but it's the fairer way to compare one month with another.
A pipeline board naturally gives you a snapshot. For month-on-month comparisons, filter your tracker by first-contact date and count that group's results.
Tracking the funnel in InboxCRM
InboxCRM is a WhatsApp CRM that runs as a Chrome extension inside WhatsApp Web. If you move chats through its pipeline board, the sales funnel dashboard is built from that board automatically. It shows how many chats sit in each stage, a conversion rate (last stage ÷ first stage), average revenue per contact and total revenue from deal values. You can switch between count and value, and export a CSV that opens in Excel or Google Sheets for your own cohort calculations.
It is a snapshot of the board you select, so put your stages in the real order a customer moves through them. You can try it without installing anything in the interactive reports and funnel tutorial. Your board and funnel data are stored locally in your browser.
A spreadsheet works just as well for these five numbers. What matters is that you check them every week.
Frequently asked questions
What is a WhatsApp sales funnel?
It is the path a buyer takes on WhatsApp, from first message to quote to paid order. Tracking how many people reach each step shows where you lose sales.
What is a good conversion rate on WhatsApp?
There is no single good rate, because it depends on what you sell and where leads come from. Track your own rate each month and aim to improve on it.
How do I calculate my WhatsApp close rate?
Divide deals won by deals that are closed (won plus lost). Leave open deals out, or the rate will drop whenever you get busy.
Sources
- How to use click to chat — WhatsApp Help Center, checked 23 September 2026
- Staying organized as a small business using Lists and quick replies on WhatsApp — WhatsApp Business, checked 23 September 2026
- COUNTIF — Google Docs Editors Help, checked 23 September 2026
- SUMIF — Google Docs Editors Help, checked 23 September 2026
InboxCRM is a WhatsApp CRM for WhatsApp Web. Pipeline, notes, follow-ups and quick replies beside every chat, with your CRM data kept in your browser.
Add InboxCRM to Chrome